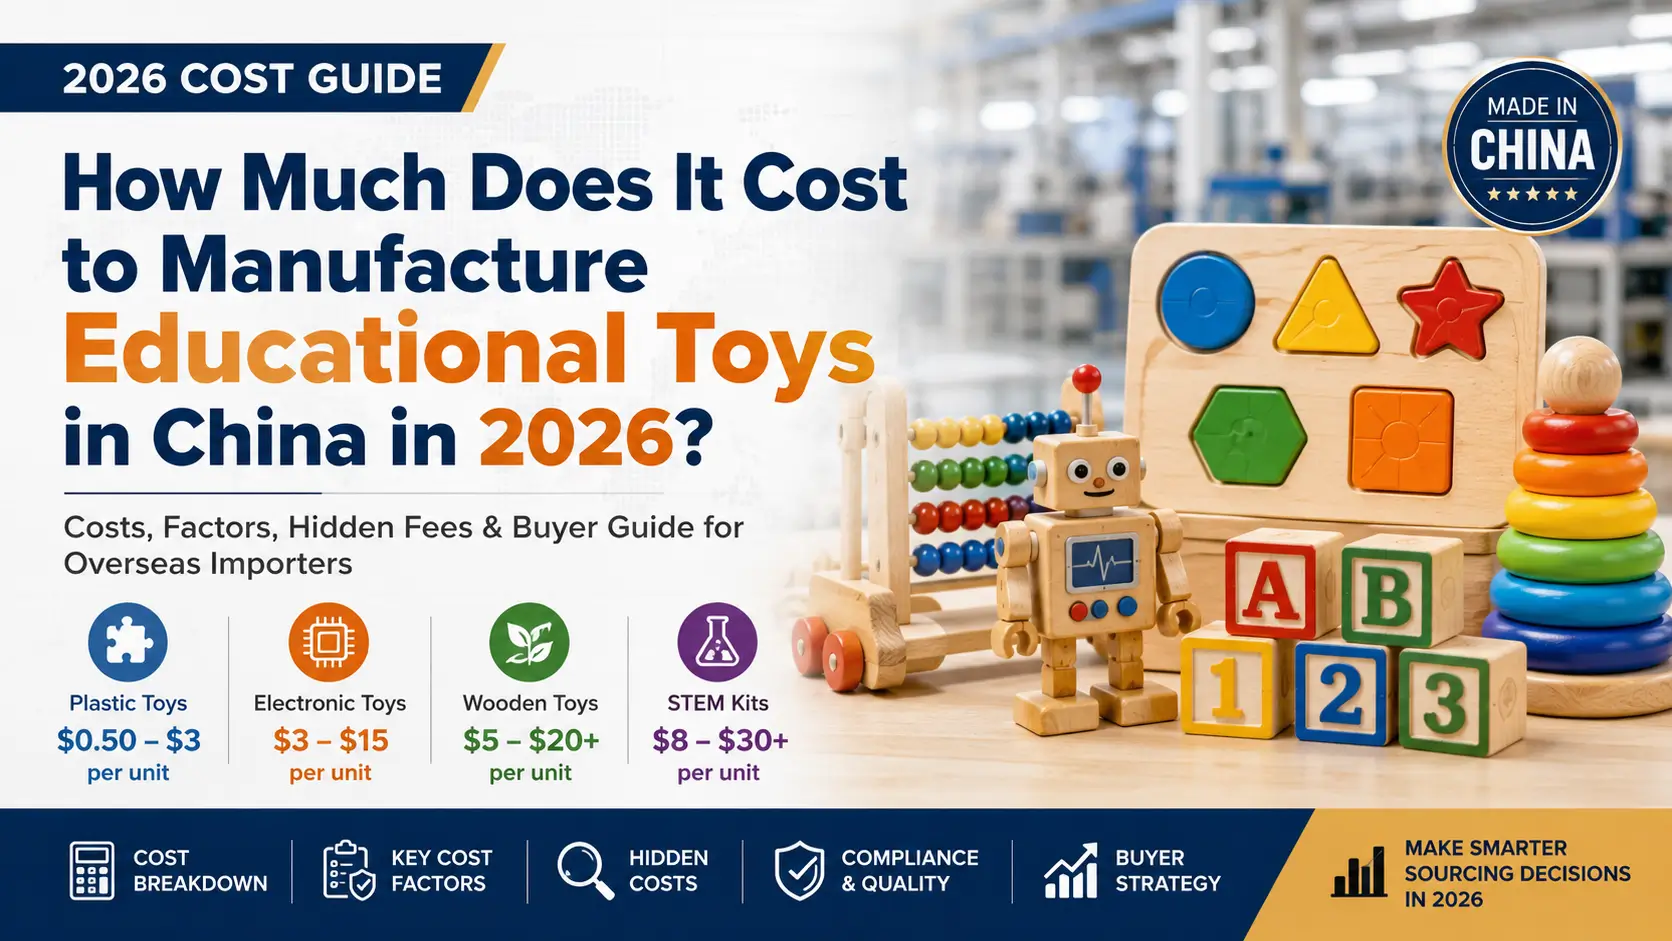
In 2026, educational toy manufacturing costs in China typically range from US$0.50–3 per unit for simple plastic toys, US$3–15 for electronic educational toys, and US$5–30+ for premium wooden, STEM, or Montessori products.
Total sourcing cost is determined by five key components: manufacturing cost, tooling cost, packaging cost, compliance testing, and logistics.
The biggest cost drivers include material selection, product complexity, certification requirements, packaging specifications, and order volume.
For most overseas buyers, certification, quality control, and defect prevention have a greater impact on total landed cost than factory pricing alone, making supplier capability more important than selecting the lowest quotation.
Educational Toy Manufacturing Cost Breakdown in China (2026)
The cost of manufacturing an educational toy in China in 2026 can be broken down into raw materials, direct labor, assembly, packaging, quality control, and factory overhead.
The final unit price varies significantly depending on product type, order volume, and additional requirements such as mold investment and compliance testing.
Educational Toy Cost Range by Product Type ($0.50–$30+ per Unit)
| Toy Type | Cost Range (per unit) |
|---|---|
| Plastic Educational Toy | $0.50 to $3 |
| Wooden / Montessori Toy | $5 to $20 |
| Electronic Educational Toy | $3 to $15 |
| STEM Kit | $8 to $30+ |
Price differences across these categories are primarily driven by three factors: materials, complexity, and assembly requirements. A simple plastic stacking toy typically uses a single mold, one material, and a fully automated assembly process, keeping the unit cost close to $1.
In contrast, a Montessori wooden puzzle requires carefully selected timber, multiple sanding stages, non-toxic coatings, and manual quality inspections, pushing the cost into the $8–$15 range.
An electronic learning tablet requires a printed circuit board, battery, speaker, LCD screen, plus multiple soldering and testing processes, making costs of $12 or more common.
This explains why one supplier may quote $3 while another quotes $15 for what appears to be a similar product. Buyers should always compare educational toy manufacturing quotes before making a sourcing decision.
Cost Breakdown Model (% of Total Manufacturing Cost)
A typical cost structure for a mid-complexity educational toy is outlined below. Raw materials account for approximately 40% of the total manufacturing cost.
For plastic-based educational toys, tooling investment, production volume, and molding complexity can significantly influence unit pricing, making it important to understand the factors behind plastic part production costs.
Direct labor contributes around 20%. Assembly and finishing processes add another 15%. Packaging generally represents 10%. Quality control and inspections account for approximately 5%. Factory overhead—including electricity, equipment depreciation, and management expenses—makes up the remaining 10%.
These percentages vary depending on product design. For electronic educational toys, electronic components and modules can account for 50% or more of total costs, while labor and assembly often remain near 15% due to semi-automated soldering and testing processes.
For wooden Montessori toys, timber and environmentally friendly finishes frequently exceed 45% of total costs, while labor can reach 25% because of manual sanding and detailed edge finishing. Understanding this cost distribution helps buyers determine which cost drivers are flexible and which are dictated by safety and quality requirements.
How MOQ Affects Unit Cost (500 vs 1,000 vs 5,000 Units)
| MOQ | Unit Cost (example: medium plastic educational toy) |
|---|---|
| 500 units | $4.5 |
| 1,000 units | $3.8 |
| 5,000 units | $3.1 |
Order volume has a substantial impact on unit pricing through several mechanisms. Mold and setup costs are spread across a larger production quantity, reducing the cost burden per unit.
Bulk raw material purchasing often unlocks supplier discounts, typically ranging from 5% to 12% when increasing order quantities from 500 units to 5,000 units.
Production lines also operate more efficiently with fewer changeovers, and worker productivity improves as teams repeat the same assembly sequence.
Many international buyers underestimate the influence of MOQ on unit cost. The difference between 500 and 5,000 units frequently exceeds 30% in unit pricing alone, even before accounting for savings from freight consolidation.
Hidden Costs Beyond Manufacturing ($500–$10,000+)
Factory quotations generally cover only the ex-works unit price. Costs that are often excluded from the initial quotation include mold and tooling fees, third-party safety testing, certification renewals, custom packaging development, and international freight.
For a typical educational toy project, these additional expenses can add $1.50 to $3.00 per unit when distributed across a reasonable production volume.
A practical example illustrates this clearly. A factory quotes $3.20 per unit FOB for an electronic alphabet board.
After adding mold amortization of $0.40 per unit, EN71 and ASTM testing fees of $0.60 per unit, a premium color box costing $0.50, and ocean freight allocation of $0.50, the total landed cost rises to $5.20 per unit.
Buyers who budget solely for the ex-factory price can face a cost overrun of approximately 60% by the time the products reach their warehouse.
Identifying these hidden costs early in the sourcing process is one of the most effective ways to avoid unexpected budget increases.
Low-Cost Supplier vs Compliant Manufacturer Comparison
| Factor | Low-Cost Supplier | Compliant Manufacturer |
|---|---|---|
| Unit quote (example) | $2.80 | $3.50 |
| Certification support | Rarely provided | Included and managed |
| Defect rate | 5% to 10% | 1% to 2.5% |
| Mold steel grade | Standard, lower lifespan | Hardened, higher durability |
| Packaging compliance | Basic, may fail lab tests | Pre-tested to market standards |
| Lead time reliability | Variable | Contractually stable |
The pattern is consistent: the lowest price does not necessarily result in the lowest sourcing cost. A $2.80 unit that generates a 7% defect rate, requires rework, misses shipping deadlines, and fails laboratory testing can ultimately cost far more than a $3.50 unit delivered on schedule with complete compliance documentation.
Experienced buyers focus on total cost of ownership rather than the initial quotation alone.
Manufacturing Capability That Influences Educational Toy Cost
A factory’s injection molding capacity, expertise in material selection, assembly line design, yield rate management, and equipment investment directly influence unit cost, product consistency, and long-term procurement risk.
Injection Molding Capacity and Cost Efficiency
Machine size and mold cavity count are among the most important cost drivers. A factory operating a 250-ton injection molding machine with a single-cavity mold produces one part per cycle.
The same machine equipped with a four-cavity mold can produce four parts per cycle, reducing per-unit molding costs by approximately 50% to 60%.
Automation further lowers labor content. Robots used for part removal and gate trimming eliminate manual handling, improve cycle consistency, and reduce molding labor costs from roughly 8% to below 3%.
For high-volume plastic educational toys, multi-cavity automated molding systems are essential for maintaining production costs below $1 per unit.
Material Selection and Cost Differences
ABS remains the most widely used plastic for educational toys due to its impact resistance, surface quality, and broad color customization options.
It typically costs between $1.80 and $2.50 per kilogram. PP offers a softer feel and lower density at approximately $1.20 to $1.60 per kilogram, making it suitable for lightweight stacking toys, although careful mold design is required to control shrinkage.
Toy-grade wood materials such as beech and birch plywood range from $800 to $1,500 per cubic meter, while FSC certification can increase costs by 15% to 25%.
Sustainable materials such as wheat-straw plastic and recycled ABS generally carry a 10% to 20% raw material premium but may support higher retail pricing through sustainability-focused marketing.
Material selection is not simply a matter of cost per kilogram—it requires balancing mechanical performance, paint adhesion, regulatory compliance, and consumer perception.
Buyers who want to understand how different toy materials affect manufacturing costs should compare material options before finalizing product specifications.
Assembly Complexity and Labor Cost Levels
A toy containing 20 components and using snap-fit assembly can typically be assembled within 90 seconds on a semi-automated production line, adding approximately $0.40 to $0.70 to the unit cost.
A toy containing 50 components, screws, wiring, and multiple testing procedures may require 4 to 6 minutes of manual assembly time, increasing unit costs by $1.80 to $3.50.
Assembly expenses scale almost directly with both component count and operation count.
Designers who reduce screw usage, consolidate components, and eliminate unnecessary subassemblies can often reduce manufacturing costs by $0.50 to $1.50 per unit without affecting the toy’s educational value or user experience.
Production Yield Rate and Cost Control
Yield rate measures the percentage of products that pass quality inspection on the first attempt. A production line operating at a 98% yield rate requires rework or scrap for only two units out of every hundred produced.
A line operating at a 92% yield rate loses eight units per hundred.
The cost difference extends beyond wasted materials. Rework consumes labor resources, disrupts production flow, and delays shipment preparation.
Across a 10,000-unit order, the difference between a 98% and a 92% yield rate can generate an additional $1,200 to $2,500 in scrap and rework expenses.
Factories that invest in process control, operator training, and in-line inspection consistently achieve higher yields and more predictable production costs.
Factory Equipment Investment vs Product Consistency
Visible capital investment often serves as a strong indicator of long-term manufacturing reliability.
CNC machining centers produce highly precise mold inserts capable of maintaining dimensional stability over 500,000 production cycles. Modern injection molding machines equipped with closed-loop control systems maintain process parameters within tight tolerances, minimizing batch-to-batch variation.
Conveyorized assembly lines with poka-yoke fixtures help prevent assembly mistakes before they occur.
For buyers, a well-equipped factory does not necessarily mean higher unit costs.
More often, it results in lower defect rates, fewer production delays, and greater consistency across repeat orders.
Equipment investment functions as a risk-mitigation strategy that protects procurement budgets throughout multiple production cycles.
MOQ and Pricing Structure Explained for Overseas Buyers
MOQ determines how setup costs, material procurement volumes, and machine utilization are distributed across production output, making it the single most influential factor in reducing unit costs while maintaining product quality.
Typical MOQ Levels for Educational Toys
OEM projects that utilize existing molds typically require an MOQ of 1,000 to 3,000 units per SKU. ODM projects using shared or semi-custom molds often begin at 500 to 2,000 units.
Fully customized educational toys that require new molds and dedicated packaging development generally require an MOQ of 3,000 to 10,000 units to recover the initial investment.
These figures should be viewed as general benchmarks. Factories specializing in low-volume production may accept orders as small as 300 units, although this usually comes with a unit price surcharge of 20% to 35%.
Why Lower MOQ Usually Means Higher Unit Cost
Three major cost categories increase as MOQ decreases. Setup and changeover expenses—including mold installation, machine calibration, and production line reconfiguration—must be spread across fewer units.
Raw materials for smaller orders are often purchased through distributors rather than directly from mills, increasing material costs by approximately 8% to 15%.
In addition, machine downtime between short production runs creates non-productive hours that factories must recover through higher margins on low-volume orders.
A 500-unit order essentially absorbs the same setup burden that could otherwise support a 3,000-unit production run.
Cost Model for 500 / 1,000 / 5,000 Units
Consider a real-world example involving a wooden educational puzzle consisting of 26 pieces, a storage box, and a full-color instruction sheet.
At 500 units, mold and fixture amortization equals $2.80 per unit, wood and paint costs total $1.90, assembly labor adds $1.50, packaging contributes $0.80, and quality control plus overhead account for $0.70, resulting in a total unit cost of $7.70.
At 1,000 units, amortization falls to $1.40 per unit. Material costs decrease to $1.70 through higher-volume purchasing. Assembly labor drops to $1.30 as worker efficiency improves. The total unit cost declines to $5.90.
At 5,000 units, amortization is reduced to just $0.28 per unit. Material costs reach $1.50, while semi-automated assembly lowers labor expenses to $0.90. The total unit cost falls to $4.40.
This progression demonstrates why experienced buyers schedule reorder volumes strategically and move up the volume curve as soon as market demand has been validated.
Packaging Options and Their Cost Impact
| Packaging Type | Cost per Unit | Typical Use |
|---|---|---|
| Polybag with header card | $0.05 to $0.15 | Entry-level, dollar-store channel |
| Full-color cardboard box | $0.30 to $0.80 | Mid-tier, retail shelf-ready products |
| Rigid gift box with insert | $0.80 to $2.00 | Premium, direct-to-consumer products |
| Eco-friendly kraft box | $0.50 to $1.50 | Sustainability-focused brands |
Packaging decisions affect much more than unit cost. A printed color box requires graphic design, structural engineering, and laboratory testing to verify heavy-metal compliance in printing inks.
Changing packaging specifications after project launch can add three to five weeks to the production schedule and generate an additional $500 to $1,500 in plate-making and sampling expenses.
Buyers should finalize packaging requirements before tooling begins to avoid costly revisions and delays.
When Buyers Should Increase Order Volume
During the market validation stage, maintaining an MOQ of 500 to 1,000 units per SKU is often the most practical strategy.
This minimizes inventory risk while allowing adjustments to packaging, features, or positioning based on customer feedback.
Once a product achieves consistent sales velocity and receives positive market reviews, increasing MOQ to 3,000 or 5,000 units can unlock unit-cost reductions of 15% to 25%.
These savings come from lower amortization costs, improved material pricing, and greater manufacturing efficiency.
The decision to scale production should be driven by verified demand data rather than a simple desire to reduce unit costs.
Hidden Costs Buyers Often Miss During Educational Toy Sourcing
Mold investment, certification expenses, inspection fees, and logistics costs are frequently excluded from a factory’s quoted unit price and can increase total procurement expenses by 40% to 60% if not properly planned.
Mold and Tooling Costs ($1,000–$30,000+)
A single-cavity cold-runner mold for a simple plastic component typically costs between $1,000 and $4,000 and can produce approximately 100,000 to 300,000 cycles before significant maintenance is required.
A multi-cavity hot-runner mold designed for a complex toy housing generally ranges from $8,000 to $30,000 and can exceed one million production cycles.
Hot-runner systems eliminate runner waste, reducing material consumption by approximately 5% to 15% per cycle. This efficiency often offsets the higher tooling investment once production volumes exceed 50,000 units.
Buyers should clearly define mold ownership, lifespan guarantees, and maintenance responsibilities within the manufacturing agreement.
When a factory retains ownership of a mold, it may use the tool for other customers. Buyer-owned molds provide greater exclusivity and sourcing flexibility.
Certification Costs (ASTM, CPSIA, EN71)
For the U.S. market, ASTM F963 mechanical and physical testing combined with CPSIA lead and phthalate compliance testing generally costs between $2,000 and $5,000 per SKU for initial certification, depending on the number of materials and coatings involved.
Annual renewals and random batch verification testing typically add $800 to $1,500 per year.
For the European market, EN71 Parts 1, 2, and 3 testing generally costs between $2,500 and $5,500 initially, with similar recurring expenses.
Electronic educational toys also require FCC and EMC testing, which typically adds another $2,000 to $4,000.
For most overseas buyers, budgeting $4,000 to $8,000 in first-year certification expenses per product line is a prudent approach.
Quality Inspection and Audit Expenses
Pre-production inspections covering raw materials and components generally cost between $300 and $500 per visit.
In-process inspections designed to identify defects before mass production continues typically cost $350 to $600 per day.
Pre-shipment inspections using AQL sampling methods usually range from $300 to $600 per lot.
For a three-SKU project involving two production batches per SKU, total third-party inspection expenses can easily reach $3,000 to $6,000.
Although these costs may appear significant, they often prevent chargebacks, product failures, and customer claims that could cost ten to fifty times more than the inspection investment itself.
Logistics and Landed Cost Calculation
Total landed cost is the most important metric when evaluating product profitability. The formula is:
Total Landed Cost = Factory Cost + Packaging + Testing and Certification + International Freight + Customs Duty
Consider a Montessori busy board with a factory cost of $8.20 per unit, packaging costs of $1.10, testing amortization of $0.70, ocean freight of $0.45, and an import duty rate of 2.5%. The resulting landed cost is approximately $10.70 per unit.
Importers who calculate retail margins based solely on factory cost often overestimate profitability by 20 to 30 percentage points. Building a complete landed-cost model before issuing a purchase order is an essential procurement practice.
Cost of Product Defects and Returns
A common pattern appears throughout the toy industry. A buyer negotiates a factory price reduction of $0.20 per unit on a 50,000-piece order, generating an apparent savings of $10,000.
Six months later, the selected paint fails compliance requirements due to lead migration, resulting in a CPSIA violation, an Amazon listing suspension, and a voluntary product recall.
Warehouse retrieval costs, customer refunds, product disposal, and legal expenses quickly escalate to $200,000.
The original $10,000 saving effectively turns into a loss that is twenty times greater. Defect-related costs rarely appear in factory quotations, yet they often become the most expensive line item on a sourcing profit-and-loss statement.
Clearly documenting material specifications and testing every production batch before shipment transforms a theoretical risk into a controlled and manageable process.
Compliance and Quality Assurance for Educational Toys
Compliance with safety regulations should not be viewed as an additional cost layer. Instead, it serves as a risk-management and cost-control strategy that protects brands from product recalls, regulatory penalties, marketplace delistings, and reputational damage.
ASTM, CPSIA, and EN71 Compliance Checklist
● ASTM F963 mechanical and physical safety requirements, including sharp-point testing, small-parts testing, drop testing, and torque testing.
● CPSIA compliance covering total lead content in coatings and substrates, as well as phthalate restrictions for accessible components.
● EN71 Part 1 for mechanical and physical properties, Part 2 for flammability, and Part 3 for migration of specific elements.
● Tracking-label requirements under CPSIA for children’s products.
● Children’s Product Certificate (CPC) supported by testing reports from CPSC-accepted laboratories.
● REACH and RoHS compliance for electronic educational toys sold within the European Union.
Maintaining this checklist as a living document for each SKU simplifies communication with manufacturers, streamlines certification workflows, and facilitates third-party audits.
Quality Control System from Raw Material to Shipment
A robust quality-control framework typically consists of four inspection stages. Incoming Quality Control (IQC) verifies plastic resin certifications, wood moisture levels, paint batch reports, and electronic component specifications before materials enter production. In-Process Quality Control (IPQC) stations positioned throughout the assembly line identify assembly defects, missing fasteners, and printing misalignment in real time.
Final Quality Control (FQC) performs 100% functional testing on electronic educational toys and applies AQL sampling methods to mechanical products. Outgoing Quality Control (OQC) verifies carton packing accuracy, barcode readability, and shipment labeling compliance before goods leave the factory.
Manufacturers operating all four quality gates typically maintain defect rates below 1.5%, whereas factories relying solely on final inspection often experience field defect rates exceeding 5%.
Safety Testing That Prevents Market Recalls
Most educational toy recalls can be traced to a limited number of root causes, including detached magnets, battery compartments that open without tools, surface coatings containing lead levels above 90 ppm, or small components breaking loose during normal use.
Each of these failure modes can be identified through standardized pre-production testing procedures. A toy that undergoes small-parts cylinder testing, drop testing, and tension testing before mold approval is significantly less likely to create choking hazards after launch. The cost of pre-production safety testing is often less than $1,500. By comparison, the cost of a product recall frequently exceeds $150,000. From a financial perspective, early-stage safety verification offers a highly favorable return on investment.
How Compliance Reduces Total Procurement Cost
Compliance lowers total procurement costs by preventing the downstream expenses associated with regulatory violations and product failures. Compliant products are less likely to encounter customs delays, marketplace suspensions, or elevated return rates.
Product liability insurance premiums are often lower when importers can demonstrate a consistent history of laboratory-tested shipments.
Over time, retailer confidence strengthens, reorder cycles accelerate, and brand reputation compounds.
Although these benefits do not appear directly on a factory quotation, they contribute significantly to long-term profitability.
Compliance functions as a cost-saving mechanism because it eliminates many of the high-cost scenarios that erode margins.
Why Compliant Factories Often Deliver Lower Total Cost
A compliant manufacturer may quote a unit price that is 8% to 15% higher than a non-compliant competitor. However, the total cost of ownership is often substantially lower.
Compliant factories operate traceable supply chains, perform in-house or third-party pre-shipment testing, maintain defect rates below 2%, and consistently provide complete documentation with on-time deliveries.
By contrast, the apparent savings offered by non-compliant suppliers frequently disappear through rework expenses, emergency air freight for delayed shipments, failed laboratory testing, customer chargebacks, and product returns.
Buyers who evaluate procurement performance across the entire sourcing cycle consistently find that compliant manufacturers deliver stronger financial outcomes.
Custom Educational Toy Development and Cost Optimization
Custom educational toy development requires upfront investment in product design and tooling.
However, strategic decisions regarding materials, feature selection, and Design for Manufacturability (DFM) can reduce unit costs by 10% to 30% without compromising educational value or play experience.
Custom Design vs OEM vs ODM Cost Comparison
| Approach | Tooling Investment | Unit Cost (Typical) | Development Time |
|---|---|---|---|
| Custom Design | $5,000 to $30,000+ | Higher but unique | 10 to 18 weeks |
| OEM (existing mold) | $0 to $2,000 | Lowest, moderate differentiation | 4 to 8 weeks |
| ODM (shared platform) | $1,000 to $5,000 | Moderate, semi-custom | 6 to 12 weeks |
Custom design provides exclusive intellectual property ownership and the strongest brand differentiation but requires greater investment and longer development cycles.
OEM solutions offer the fastest and most economical route to market, although competitive overlap is common. ODM occupies the middle ground, allowing customization of colors, packaging, and selected features on an established product platform.
The most appropriate approach depends on the brand’s channel strategy, positioning, and target margin structure.
Material Optimization Strategies That Reduce Cost by 10–30%
Replacing polycarbonate with ABS in non-transparent structural components can reduce resin costs by approximately 20% to 30% while maintaining sufficient impact resistance for most educational toy applications.
Substituting solid wood blocks with birch plywood laminates can lower material costs by around 15% while improving dimensional stability.
Selecting a standard Pantone color from the factory’s existing color library rather than requesting a custom-matched color can eliminate a $200 to $500 color-matching fee and shorten lead times by approximately one week.
Although every material change must still satisfy applicable safety requirements, these savings can accumulate significantly across larger production volumes.
When to Add Electronic Features and When to Avoid Them
Adding sound modules, LEDs, sensors, or other electronic components typically increases manufacturing costs by $2 to $8 per unit, introduces FCC and EMC certification requirements, and creates additional failure risks such as battery leakage, connector failure, or solder-joint fatigue.
Electronic functionality delivers strong commercial value when it forms the core educational mechanism, such as in phonics tablets, coding robots, or interactive STEM learning systems.
However, electronics can become a cost burden when they are merely decorative enhancements that do not meaningfully influence a child’s engagement or a parent’s purchasing decision.
A practical evaluation method is to ask whether removing the electronic feature would significantly reduce the product’s perceived retail value. If the answer is no, the electronics are likely increasing cost without generating additional revenue.
Designing for Manufacturability (DFM) to Lower Cost
DFM principles often generate some of the highest-return cost reductions available during product development. Reducing component count from 28 parts to 19 parts by integrating snap-fit functionality can eliminate nine assembly operations and reduce labor costs by approximately $0.70 per unit.
Standardizing screw sizes across the entire product allows manufacturers to use a single fastener specification, reducing inventory complexity and lowering the risk of assembly errors.
Optimizing parting lines and draft angles during mold design can shorten cycle times by 8% to 12%, reducing processing costs while increasing daily production output.
Involving the factory’s tooling engineer during the early 3D design phase, rather than after CAD files are finalized, frequently reduces tooling expenses by 10% to 20% and minimizes costly engineering revisions.
Balancing Product Innovation and Commercial Viability
The most commercially successful educational toys are not necessarily those with the highest feature count or the most sophisticated engineering.
Instead, they are products that deliver a clear educational value proposition at a price point parents perceive as reasonable while maintaining healthy margins throughout the distribution chain.
A product designed to retail for $29.99 with a landed cost of approximately $8 can provide sufficient margin for distributors, retailers, and brand owners alike.
By contrast, adding features that increase landed cost to $14 while maintaining the same retail price compresses margins across the entire channel and reduces long-term sustainability.
Aligning product specifications with target unit economics during the earliest stages of development is often the difference between a product that merely launches and one that scales successfully.
In 2026, educational toy manufacturing costs in China range from approximately $0.50 to more than $30 per unit, depending on materials, complexity, certification requirements, and production volume.
However, the most effective sourcing strategy is not finding the lowest-cost supplier. It is partnering with a compliant manufacturer capable of delivering consistent quality, regulatory compliance, and reliable production performance.
For most international buyers, certification expenses, defect rates, and supply-chain reliability have a greater influence on total landed cost than factory pricing alone.
Buyers who evaluate total procurement costs systematically and align product development decisions with economic realities consistently achieve stronger margins, lower risk exposure, and more resilient supply chains.